
Some Matlab Applications of Distance and Similarity Measures for Fuzzy Sets
Abstract
The aim of this study is to compare the similarity ratios between the Sobel, Prewitt, Laplacian, Canny and Robert-Cross edge detection filters, which are frequently used in edge detection, and the fuzzy edge detection filter obtained using fuzzy logic with the help of Hamming, Euclidean and Minkowski distance measures in Matlab.
Keywords:Fuzzy setFuzzy distance measuresFuzzy similarity measuresMatlab
1. Introduction
In classical (Aristotelian) logic, which is a system of logic with two truth values, the classical concept of set is based on whether an object is an element of that set or not. There can never be partial membership. If the membership value of the object is 1, it is an element of the set, and if it is 0, it is not an element. The transition between linguistic concepts frequently used in daily life is not as sharp as in classical logic, so classical logic is not suitable for describing these expressions numerically. However, with fuzzy logic, these words can be easily defined without the need for much additional information and can be more accurately characterised by fuzzy sets.
The basic definitions of fuzzy logic and fuzzy set theory, which is an extension of multivalued logic and uses the rules of classical logic, were introduced by Zadeh in [1]. Subsequently, fuzzy logic has provided a new dimension for dealing with uncertain systems and has enabled many studies in numerous fields [2]–[4]. A fuzzy set A in a non-empty set X is characterised by a mapping
uA: X → [0,1], where uA is called membership function and uA(x) is called degree of membership of the element x. That is, a fuzzy set A is shown as A = {(x, uA(x)): x ∈ X and uA(x) ∈ [0,1]}.
Throughout the paper, FX is regarded as the class of all fuzzy sets of X and A is regarded as the complement of the fuzzy set A.
Image filtering, a technique used in image processing, is used to reduce noise in the image, sharpen edges, sharpen the image and obtain a clearer image. Image filters are usually expressed as a matrix or kernel. Edge detection filters, which have become the most active area of image processing in recent years, are image filters used to detect edges (i.e., points where two regions with different pixel values meet) in an image. These filters work by calculating the difference between a pixel and other pixels around it.
Edge detection operators are generally divided into two. The first one is the gradient-based edge operators using first order derivatives, such as Sobel, Prewitt and Robert operators. The other one is the edge operators using second order derivative based methods and Laplacian can be given as an example.
Sobel edge detection: The edges in this technique are found using 3 × 3 neighbourhood image filter. Prewitt edge detection: The edge detection in this technique is estimated using simplified 3 × 3 neighbourhood image filter.
Roberts-Cross edge detection: In this type of edge detection technique, the image filter is a 2 × 2 image gradient measurement applied on the image matrix.
Canny edge detection: In this technique, an objective function to be optimized is developed. The solution to this problem is an exponential function, which could be approximated and optimizes the edge.
Laplacian edge detection: In this type of edge detection technique, the image filter is a 3 × 3 Laplacian core matrix applied on the image filter.
The use of fuzzy logic in image edge detection techniques has an important place in the literature. When fuzzy logic is used for edge detection, softer, blurred edges can be obtained instead of sharp edges.
Fuzzy edge detection: In this type of edge detection technique, general steps are summarized as follows: 1) the input image is blurred using a blurring process, 2) gradient is calculated on the blurred image, and 3) thresholding is used to sharpen the edges and suppress transitions to the background.
Readers interested in edge detection can check out [5]–[7] articles for more information.
Xuecheng [8] introduced the basic axioms of distance and similarity measures and analysed the relationship between these measures with examples. Then, many researchers [9]–[13] have generalised distance and similarity measures using the concept of fuzzy logic. The distance measure of two fuzzy sets is a measure that describes the difference between the fuzzy sets. Also, the similarity measure of two fuzzy sets shows the similarity between the fuzzy sets. The higher value of similarity measure indicates that the images using two of the edge detection techniques are similar.
A function d ∶ FX × FX → ℝ is said to be a distance function if the following properties are satisfying:
I. d(A, B) = d(B, A), for all A, B ∈ FX.
II. d(A, A) = O, for all A ∈ FX.
III. d(D, D ) = maxA,B∈F d(A, B) for all D ∈ X (The power set).
IV. If A ⊂ B ⊂ C, then d(A, B) ≤ d(A, C) and d(B, C) ≤ d(A,C) for all A, B, C ∈ FX.
The Hamming distance, used for discrete data such as binary values, calculates the number of different positions of the corresponding symbols. It is shown as follows:
d(x, y) = ∑(xi ≠ yi).
The Euclidean distance is used to compare features of images and identify similar images. It is shown as follows:
( ) √ ( )2 d x, y = ∑ xi − yi .
The Minkowski distance, is a generalization of the Euclidean distance, compare two images by measuring the similarity of their pixel values. It is shown as follows:
p p p p
d(x, y) = (|x1 − y1| + |x2 − y2| + ⋯ + |xn − yn| ) .
A function S ∶ FX × FX → ℝ is said to be a similarity function if the following properties are satisfying:
I. S(A, B) = S(B, A) for all A, B ∈ FX.
II. S(A, A ) = O for all A ∈ X.
III. S(C, C ) = maxA,B∈F S(A, B) for all C ∈ FX.
IV. If A ⊂ B ⊂ C, then S(A, B) ≥ S(A, C) and S(B, C) ≥ S(A, C) for all A, B, C ∈ FX.
2. Experimental Results
In this section, we compare the similarities for image comparison. To do this, for an image, Sobel, Prewitt, Laplacian, Canny, Robert Cross edge detection filters and fuzzy edge detection filter are used. We compare the similarity ratios of these with the help of Hamming, Euclidean and Minkowski distance measures. The chosen original image and the images obtained after using edge detection filters are given below:


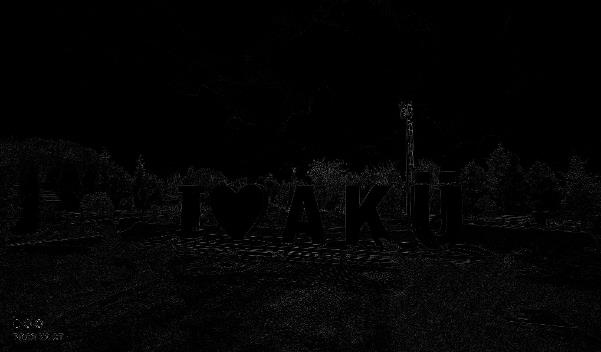
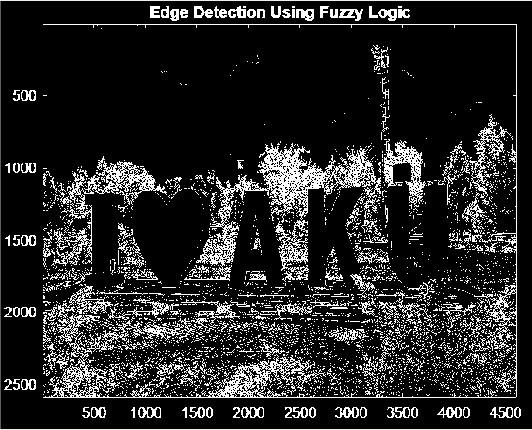
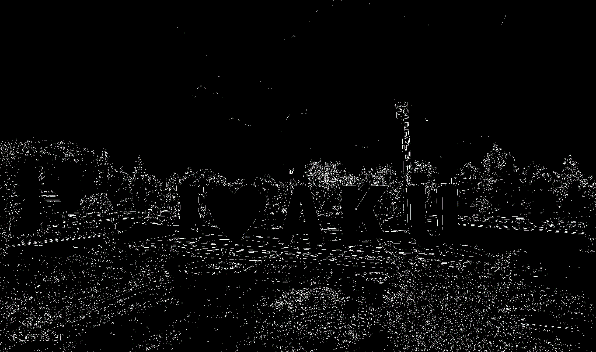
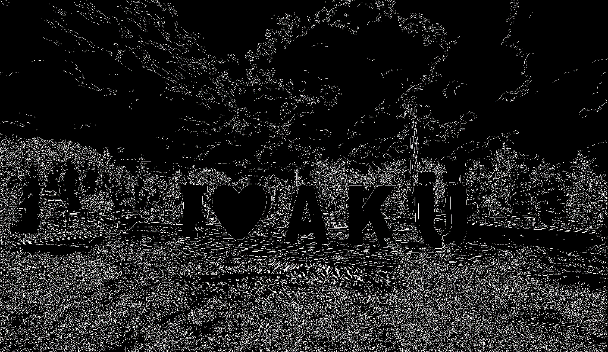
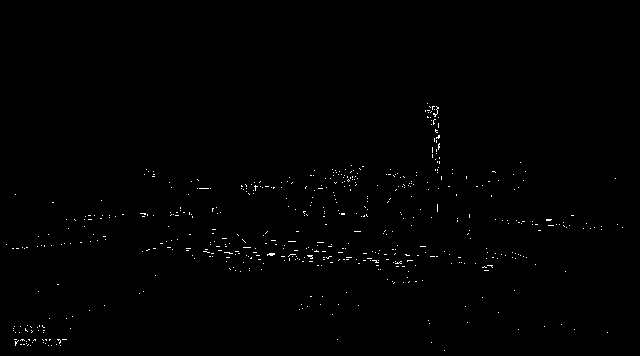
Table 1. The similarity function was applied to the Hamming, Euclidean and Minkowski distances.
This table is shown in the PDF version of the article.
Table 2. The similarity function was applied to the Hamming, Euclidean and Minkowski distances.
This table is shown in the PDF version of the article.
3. Conclusion
This study confirms that fuzzy edge detection filters are an effective approach in image processing. In fuzzy edge detection, the detection of edges in the image has shown successful results. While traditional edge detection techniques can detect sharp edges well, they cannot extract noisy and irregular edges properly. Therefore, fuzzy edge detection methods better handle objects and edges with more complex image structure.Also, in the first table, according to the Hamming distance, the similarity ratio between the Canny and fuzy methods is the highest. The similarity ratio determined according to Euclidean and Minkowski distances is the highest value between the Robert Cross and fuzzy methods.
In the second table, according to Hamming and Euclidean distances, the similarity ratio between the Laplacian and fuzzy methods is the highest. The similarity ratio determined according to Minkowski distance is the highest value between the Sobel and fuzzy methods.
Author Contributaion
Conceptualization, E.G. and Ö.K.; Methodology, E.G. and Ö.K.; Validation, E.G. and Ö.K.; formal analysis, E.G.; investigation, Ö.K.; resources, Ö.K.; data maintenance, Ö.K.; writing-creating the initial design, E.G.; writing-reviewing and editing, E.G. All authors have read and agreed to the published version of the manuscript. Authorship must be limited to those who have made a significant contribution to the work reported.
Funding
No funds, grants, or other support was received.
Data Availability
Data sharing is not applicable to this article as no new data were created or analyzed in this study.
Conflicts of Interest
The authors declare no conflict of interest.
References
- [1] Zadeh, L. A. (1965). Fuzzy sets. Information and control, 8(3), 338–353. https://doi.org/10.1016/S0019-9958(65)90241-X
- [2] Atanassov, K.T. (1999). Intuitionistic fuzzy sets. Physica, Heidelberg. https://doi.org/10.1007/978-3-7908-1870-3_1
- [3] Goguen, J. A. (1967). L-fuzzy sets. Journal of mathematical analysis and applications, 18(1), 145–174. https://doi.org/10.1016/0022-247X(67)90189-8
- [4] Pang, B. (2014). On (L, M)-fuzzy convergence spaces. Fuzzy sets and systems, 238, 46–70. https://doi.org/10.1016/j.fss.2013.07.007
- [5] Aborisade, D. O. (2010). Fuzzy logic based digital image edge detection. Global journal of computer science and technology, 10(14), 78–83. https://computerresearch.org/index.php/computer/article/view/657
- [6] Kushwaha, N. (2012). Edge detection using fuzzy logic in Matlab. International journal of advanced research in computer science and software engineering, 2(4), 38–40. https://B2n.ir/ps1974
- [7] Muhammad Rizky Alditra Utama, K., Umar, R., & Yuhdana, A. (2022). Edge detection comparative analysis using Roberts, Sobel, Prewitt, and Canny methods. Jurnal teknologi dan sistem komputer, 10(2), 67–71. https://doi.org/10.14710/jtsiskom.2021.14209
- [8] Xuecheng, L. (1994). Entropy, distance measure and similarity measure of fuzzy sets and their relations. Fuzzy sets and systems, 62(3), 377. https://doi.org/10.1016/0165-0114(94)90124-4
- [9] Liu, H. W. (2005). New similarity measures between intuitionistic fuzzy sets and between elements. Mathematical and computer modelling, 42(1–2), 61–70. https://doi.org/10.1016/j.mcm.2005.04.002
- [10] Setnes, M., Babuška, R., Kaymak, U., & Van Nauta Lemke, H. R. (1998). Similarity measures in fuzzy rule base simplification. IEEE transactions on systems, man, and cybernetics, part b: Cybernetics, 28(3), 376–386. https://doi.org/10.1109/3477.678632
- [11] Omran, S., & Hassaballah, M. (2006). A new class of similarity measures for fuzzy sets. International journal of fuzzy logic and intelligent systems, 6(2), 100–104. https://doi.org/10.5391/IJFIS.2006.6.2.100
- [12] Chen, S. M., Yeh, M. S., & Hsiao, P. Y. (1995). A comparison of similarity measures of fuzzy values. Fuzzy sets and systems, 72(1), 79–89. https://doi.org/10.1016/0165-0114(94)00284-E
- [13] Beg, I., & Ashraf, S. (2009). Similarity measures for fuzzy sets. Applied and computational mathematics, 8(2), 192–202. https://www.researchgate.net/publication/228744370