
IoT-Driven Water Quality Monitoring Systems for Smart
Abstract
Water quality monitoring systems in smart cities, driven by the Internet of Things (IoT), utilize interconnected sensors to continuously measure parameters such as pH, turbidity, and contaminants. These systems offer real-time data and analysis, making it possible to quickly identify problems like contamination or leaks. By incorporating machine learning, they aid in forecasting trends and enhancing resource management. The architecture of the system consists of sensing, communication, and data processing layers, with wireless protocols used to transmit information for analysis. These systems enhance urban water management, promote sustainable development, and efficiently address water quality challenges.
Keywords:Predictive analyticsResource optimizationCloud computingEnvironmental monitoring
1. Introduction
As urban populations grow and cities become increasingly complex, ensuring access to clean and safe water has become a pressing challenge. Water quality is critical for public health, environmental sustainability, and economic development, especially in smart cities. These cities leverage advanced technologies to create interconnected, intelligent systems that enhance the quality of life for their residents. Among these technologies, the Internet of Things (IoT) has emerged as a game-changer for real-time monitoring and management of urban infrastructure, including water distribution systems. IoT-driven water quality monitoring systems enable continuous, automated tracking of essential water parameters such as pH, turbidity, temperature, and contaminant levels [1], [2]. By deploying a network of sensors throughout the water supply chain, from reservoirs and pipelines to treatment plants, IoT technology allows city authorities to monitor water quality remotely and respond quickly to any anomalies [3], [4]. This real-time monitoring ensures compliance with regulatory standards and reduces the risks associated with water contamination or system failures [5]. This paper will explore the architecture, implementation, and benefits of IoT-based water quality monitoring systems in smart cities. We will also discuss the challenges of deploying such systems, including data security concerns, sensor maintenance, and the need for a robust communication infrastructure to support IoT networks [6], [7].
2. Figures and Tables
Sensor layer pH sensor Measures the acidity or Tracks pH levels to ensure alkalinity of water in reservoirs, water quality standards are pipelines, and treatment plants. met.
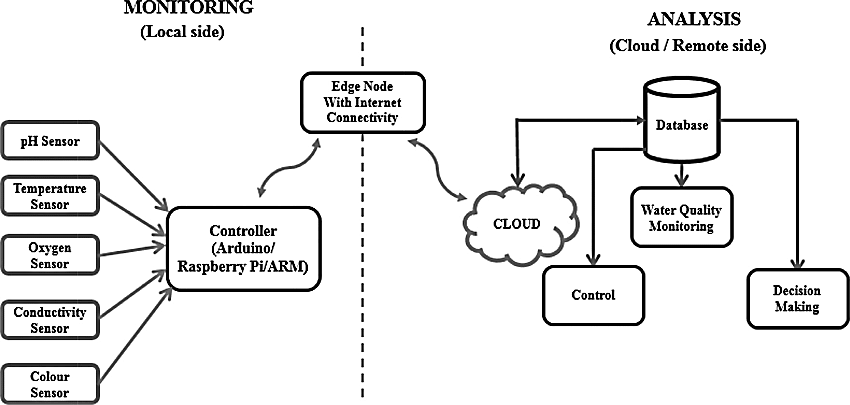
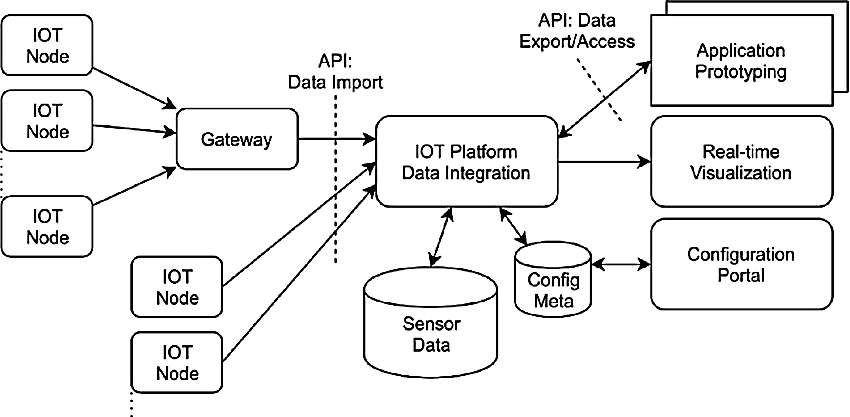
Table 1. List of water quality monitoring system architecture [9], [10].
This table is shown in the PDF version of the article.
Turbidity sensor Measures water clarity by Monitors water clarity to detecting suspended particles. detect contamination or inefficiencies in water treatment.
Temperature sensor Measures the temperature of Ensures water remains within water in different parts of the optimal temperature ranges for water distribution system. quality and biological safety. Dissolved Oxygen (DO) Measures the oxygen levels in Ensures the water has sufficient sensor water, critical for aquatic life and oxygen levels to support life and water quality. prevent contamination.
Conductivity sensor Measures the electrical Helps identify pollution or conductivity of water to detect changes in water mineral content. dissolved salts and contaminants.
Communication LoRaWAN Long-range, low-power wireless Transmits sensor data over long layer protocol used for data distances with minimal power transmission from remote consumption.
sensors.
Zigbee Short-range, low-power wireless Connects nearby sensors to protocol ideal for sensor data gateways or the cloud for real-transmission in localized time monitoring.
environments.
NB-IoT Narrowband IoT protocol that Optimized for transmitting data enables efficient, low-bandwich across urban areas with high communication for urban water sensor density.
networks.
Cloud layer Cloud data processing Cloud-based infrastructure that Enables real-time analytics, long-processes incoming sensor data, term storage, and decision-analyzes it, and stores it. making based on water data. User interface Dashboard or mobile application Allows stakeholders (city where users can view water authorities, technicians) to quality metrics and alerts. monitor water quality and system status.
3. Variables
Designing an IoT-driven water quality monitoring system architecture involves several components and variables to ensure effective data collection, processing, transmission, and analysis. Here’s an outline of the key variables and equations that may be relevant.
3.1 Sensors
Variables
I. TTT: Temperature (°C) II. pH: pH level III. DO: (mg/L) IV. Turb: Turbidity (NTU) V. EC: Electrical Conductivity (µS/cm) VI. COD: Chemical Oxygen Demand (mg/L)
Sensor accuracy
A (Percentage)
3.2 Data Transmission
Network variables
I. R: Data rate (bps) II. D: Data packet size (bytes) III. L: Latency (ms)
Transmission distance
Dtrans (Meters)
3.3 Data Processing
Processing unit
P: Processing power (In FLOPS or MIPS)
E (Joules)
3.4 Storage
Storage capacity
S (GB)
Data retention period
Tret (Days)
3.5 Power Supply
Lb (Hours)
Power consumption
Pcons (mW)
3.6 User Interface
User engagement
Ueng (Number of users)
Alerts/notifications
N (Number of alerts)
4. Equations
Data collection rate
Rcollection = Fs × Ns,
whrere Fs is the frequency of sampling (Samples per second), and Ns is the number of sensors.
Data transmission time
Ttrans = ,
where D is the data packet size and R is the data rate.
E = Pcons × Tusage,
where Tusage is the total active time of the devise.
Lb = , Pcons where C is the battery capacity (In mAh).
Data storage needs
Sneeded = Rcollection × Tret,
where Rcollection is the rate of data collection and Tret is the retention period in seconds.
Water Quality Index (WQI)
A composite index calculated from various parameters:
WQI = ∑ wi. vi,
where wi is the weight of each parameter (Determined based on its importance), and vi is the normalized value of each parameter.
5. Conclusion
Implementing IoT-driven water quality monitoring systems offers significant advancements in managing water resources for smart cities. Integrating real-time data collection, edge computing, and cloud-based analytics enables proactive water quality management, ensuring the safety and sustainability of urban water supplies.
This approach allows for continuous monitoring, early detection of contamination, and prompt decision-making, reducing the risks associated with polluted water and contributing to urban populations' overall health and well-being. Furthermore, IoT in such applications enhances operational efficiency, reduces manual intervention, and offers cost-effective solutions for municipal water management.
As cities grow, scaling IoT-driven water monitoring solutions will become increasingly critical for addressing water scarcity, pollution, and infrastructure challenges. Future research could focus on improving sensor accuracy, expanding the scope of parameters monitored, and integrating machine learning to predict potential issues before they arise.
In conclusion, IoT-based water quality monitoring systems are pivotal to the development of smart, sustainable cities. They provide valuable insights for decision-makers and contribute to the efficient, safe management of vital water resources.
Acknowledgments
We thank KIIT university for providing essential resources and the technical and administrative staff for their support.
Author Contributaion
Suvam Behera: Conceptualization of the study and writing the original draft, overall project administration, final editing of the manuscript, implementation of algorithm.
Funding
The research received no external funding.
Data Availability
The data used and analyzed during the current study are available from Suvam Behera upon reasonable request.
Conflicts of Interest
The author declare no conflicts of interest regarding the publication of this paper.
If necessary, these sections should be tailored to reflect the specific details and contributions.
References
- [1] Priya, M. D. (2021). Smart water quality monitoring system using IoT. CVR journal of science and technology, 21(1), 31–38. https://www.cvr.ac.in/ojs/index.php/cvracin/article/view/736
- [2] de Paula, H. T. L., Gomes, J. B. A., Affonso, L. F. T., Rabelo, R. A. L., & Rodrigues, J. J. P. C. (2019). An IoT-based water monitoring system for smart buildings. 2019 IEEE international conference on communications workshops (ICC workshops) (pp. 1–5). IEEE. https://doi.org/10.1109/ICCW.2019.8756905
- [3] Mohapatra, H., & Rath, A. K. (2020). IoT-based smart water. In IoT technologies in smart cities: From sensors to big data, security and trust (pp. 63–82). Institution of engineering and technology. http://dx.doi.org/10.1049/PBCE128E
- [4] Hemdan, E. E. D., Essa, Y. M., Shouman, M., El-Sayed, A., & Moustafa, A. N. (2023). An efficient IoT based smart water quality monitoring system. Multimedia tools and applications, 82(19), 28827–28851. https://doi.org/10.1007/s11042-023-14504-z
- [5] Mohapatra, H., & Rath, A. K. (2019). Detection and avoidance of water loss through municipality taps in India by using smart taps and ICT. Institution of engineering and technology wireless sensor systems, 9(6), 447–457. https://doi.org/10.1049/iet-wss.2019.0081
- [6] Jan, F., Min-Allah, N., & Düştegör, D. (2021). IoT based smart water quality monitoring: Recent techniques, trends and challenges for domestic applications. Water, 13(13), 1729. https://doi.org/10.3390/w13131729
- [7] Rathi, S., & Gola, V. K. (2024). Innovative components of smart cities with a special focus of water distribution systems challenges and opportunities: A review. Institute of physics conference series: Earth and environmental science (pp. 12146). Institute of physics publishing. http://doi.org/10.1088/1755-1315/1326/1/012146
- [8] Hynes, R., Jagatheesaperumal, S., Kamyab, H., Jesudoss, A. J. S., Al-Khashman, O., Kuslu, Y., … ., & Suresh, B. (2020). Modern enabling techniques and adsorbents based dye removal with sustainability concerns in textile industrial sector -a comprehensive review. Journal of cleaner production, 272, 122636. http://dx.doi.org/10.1016/j.jclepro.2020.122636
- [9] Chen, S. L., Chou, H. S., Huang, C. H., Chen, C. Y., Li, L. Y., Huang, C. H., … ., & Huang, J. S. (2023). An intelligent water monitoring IoT system for ecological environment and smart cities. Sensors, 23(20), 8540. https://doi.org/10.3390/s23208540
- [10] Chen, Y., & Han, D. (2018). Water quality monitoring in smart city: A pilot project. Automation in construction, 89, 307–316. https://doi.org/10.1016/j.autcon.2018.02.008