
Fuzzy Social Network Analysis in Industry Academic Collaborations
Abstract
Industry-academic collaborations form intricate networks of researchers, institutions, and knowledge exchange. Traditional Social Network Analysis (SNA) techniques often fail to capture the uncertainties and imprecise relationships in these networks. This research introduces a fuzzy graph-based approach to model industry-academic collaborations, where relationships are characterized by varying degrees of membership, trust, influence, and contribution. We explore applications such as co-authorship networks, research impact analysis, and interdisciplinary collaboration mapping. A case study on global academic networks is provided, demonstrating the effectiveness of fuzzy SNA in analyzing uncertain and evolving relationships.
Keywords:Fuzzy graphsSocial network analysisIndustry-academic collaborationsCo-authorship networksResearch impactUncertainty modeling
1. Introduction
Academic networks are inherently complex, dynamic systems composed of diverse entities such as researchers, educational institutions, funding agencies, and scholarly communities. These entities interact through a variety of mechanisms, including co-authorship, joint research projects, institutional affiliations, citations, conference participation, and grant collaborations. As such, understanding the structure and dynamics of academic networks is crucial for evaluating research impact, fostering innovation, and guiding strategic collaboration and funding decisions.
Traditional Social Network Analysis (SNA) [1]-[4] has been widely used to study these academic interactions. Typically, SNA represents these relationships using graph-based models where nodes correspond to actors (e.g., researchers or institutions), and edges represent binary or weighted connections such as co-authorships or citation links. However, conventional SNA methods often rely on crisp, well-defined relationships, which may not capture the inherent ambiguity and variability present in real-world industry-academic collaborations. For instance, not all co-authorships imply equal contribution, not all institutional partnerships reflect the same level of engagement, and emerging interdisciplinary collaborations often exhibit fluid, evolving structures. To address these limitations, Fuzzy Social Network Analysis (FSNA) [5], [6] has emerged as a promising extension to conventional SNA. FSNA incorporates the principles of fuzzy logic to model relationships that are not strictly binary or deterministic, allowing for degrees of membership, trust, influence, and collaboration intensity. By assigning fuzzy weights to connections, FSNA provides a more granular and realistic representation of academic relationships, particularly in environments characterized by uncertainty, partial knowledge, or evolving interactions.
This paper explores the application of FSNA in the context of industry-academic collaborations, with a particular focus on its capacity to model uncertain, dynamic, and interdisciplinary research networks. We aim to highlight how FSNA enhances the analytical power of traditional SNA by accommodating nuances such as informal collaborations, varying levels of researcher influence, and the temporal evolution of academic partnerships. Additionally, we investigate the methodological frameworks, computational techniques, and potential use cases where FSNA can be applied to generate actionable insights in academic policy-making, funding allocation, and research strategy development.
2. Fundamentals of Fuzzy Social Network Analysis
2.1 Fuzzy Graph
A fuzzy graph is a generalization of a traditional graph that incorporates uncertainty by assigning fuzzy values to its vertices (Nodes) and edges (Connections). It is instrumental in situations where relationships and memberships are not strictly binary (i.e., they exist to some degree rather than being simply present or absent) [7]–[9].
A fuzzy graph is represented as
where, I. V is the set of nodes (Vertices).
II. is the set of edges (Connections between nodes).
III. The fuzzy membership function assigns a degree of membership to each node, indicating how strongly it belongs to the network.
IV. is the fuzzy relationship function that assigns a degree of strength to each edge, representing the intensity or reliability of the connection between nodes.
Key features of fuzzy graphs
Partial membership: Nodes may partially belong to the graph with a value between 0 and 1.
Uncertain relationships: Edges may have different strengths instead of being simply present or absent. Flexible representation: Useful in real-world applications like social networks, recommendation systems, and decision-making where uncertainty exists (Fig. 1).
2.2 Social Network Analysis
SNA is a methodological framework for analyzing the structure and dynamics of social relationships among entities, represented as nodes (Actors) and edges (Connections) in a network graph. In the context of academic collaborations, SNA models researchers, institutions, or publications as nodes, with edges denoting interactions such as co-authorships, citations, or joint projects. These relationships are typically represented in binary or weighted forms, capturing whether a connection exists and, optionally, its strength or frequency. SNA facilitates the study of patterns such as centrality, clustering, influence, and connectivity within the network, providing insights into the roles of individual actors and the overall topology of the academic community [10], [11] (Fig. 2).
In the traditional SNA model, the academic collaboration among researchers A, B, C, and D is represented as a simple undirected graph where nodes signify researchers and edges indicate the presence of a co-authorship. If two researchers have collaborated on at least one publication, an edge is drawn between them, without considering the depth, frequency, or nature of the collaboration. For example, if researcher A has co-authored papers with both B and C, two binary edges are created: A—B and A—C. Similarly, an edge between B and D denotes their joint publication. All connections are treated equally in terms of strength if each co-authorship represents the same level of engagement. While this model effectively maps the presence of collaborative ties, it fails to capture the nuances of the relationships—such as how frequently researchers collaborate or the degree of their contribution—thus providing a limited view of the network's complexity.
2.3 Fuzzy Social Network Analysis
FSNA is an advanced extension of traditional SNA that incorporates the principles of fuzzy logic to model imprecise, uncertain, and gradually varying relationships within a network. In FSNA, both nodes (Entities) and edges (Relationships) are assigned fuzzy values to represent degrees of participation, influence, or collaboration strength. The assigned fuzzy values allow for the representation of partial memberships and the intensity of social interactions, rather than relying on binary or crisp relationships. In academic networks, FSNA enables more accurate modeling of phenomena such as unequal co-authorship contributions, informal collaborations, fluctuating research activity, and interdisciplinary interactions, providing a richer and more flexible framework for analyzing complex and dynamic social structures (Fig. 3).
In contrast, FSNA enriches the traditional model by introducing fuzzy logic to express the uncertainty and varying intensity in academic collaborations. Using the same set of researchers (A, B, C, and D), FSNA assigns a fuzzy membership value (μ) to each node, reflecting the individual's level of involvement in the research community—for example, A may have a high participation level (μ=0.9) while C is more passive (μ=0.4). Similarly, the edges are weighted with fuzzy values (ξ) representing the strength or intensity of collaboration, such as frequent and meaningful co-authorships between A and B (ξ=0.85) or a one-off collaboration with minimal interaction between A and C (ξ=0.3). This approach provides a more realistic and expressive representation of academic networks by accommodating partial involvement, informal collaborations, and evolving relationships. FSNA thus offers a nuanced view of social structures, better reflecting the complexities of scholarly interaction.
3. Applications of Fuzzy Social Network Analysis in Academic Collaborations
Co-authorship network analysis
Fuzzy graphs enhance co-authorship network analysis by considering partial contributions of authors to papers. Unlike binary collaboration networks, FSNA assigns fuzzy weights to collaborations based on authorship order, contribution percentage, and citation impact, enabling a more realistic evaluation of academic partnerships.
Research impact and influence ranking
Traditional citation-based influence metrics, such as the h-index, fail to capture varying degrees of contribution and influence. FSNA incorporates fuzzy centrality measures to rank researchers based on their actual impact, considering weighted co-authorships, interdisciplinary reach, and citation quality.
Interdisciplinary collaboration mapping
Academic research increasingly spans multiple disciplines, making traditional SNA methods inadequate in capturing cross-field interactions. Fuzzy graphs allow for the representation of interdisciplinary collaboration with varying degrees of association, reflecting real-world research dynamics.
Funding and institutional networks
FSNA provides insights into funding distribution and institutional collaboration patterns by modeling uncertain relationships between researchers, universities, and grant agencies. It helps identify strong and weak ties in academic funding networks, improving research policy and collaboration strategies.
4. Case Study: Global Academic Networks
To illustrate the effectiveness of FSNA, we analyze an international dataset of academic collaborations. We construct a fuzzy academic network where:
I. Nodes represent researchers and institutions.
II. Edges represent co-authorships and research collaborations with fuzzy weights indicating contribution strength.
III. Fuzzy influence measures are applied to rank researchers based on their impact and interdisciplinary reach. Preliminary results reveal that FSNA better captures the dynamics of research collaborations compared to traditional methods, particularly in assessing interdisciplinary and cross-institutional partnerships.
5. Fuzzy Co-Authorship Network in a Research Institution
This section presents a conceptual diagram that illustrates the structure and dynamics of academic collaboration within a research institution using the framework of FSNA. The diagram provides a visual representation of researchers and institutions as interconnected entities, where the strength of each connection is modelled with fuzzy weights to reflect varying levels of collaboration.
5.1 Illustration 1
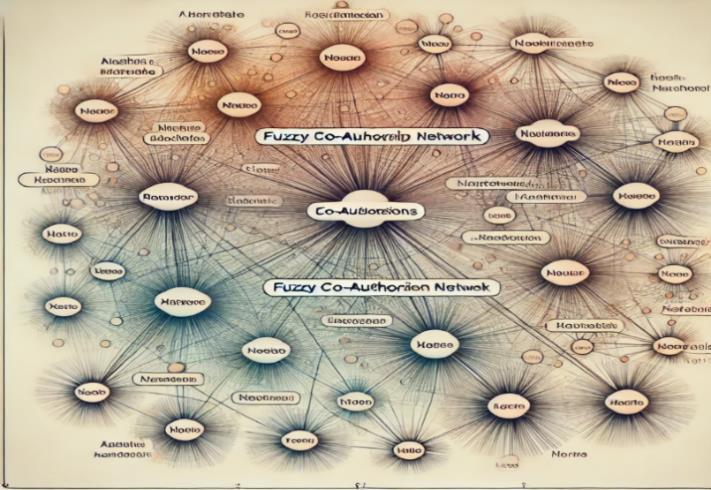
It visually represents researchers and institutions as nodes, with edges indicating collaboration strength through varying thickness and colour intensity (Fig. 4).
5.1.1 Diagram elements
Nodes (Researchers and institutions): Represent individual researchers and affiliated academic or research institutions. These nodes are visualized as circles of uniform size or color-coded based on research domain or affiliation.
Edges (Collaborative links): Represent collaborative relationships between entities, primarily co-authorships, joint publications, or research projects. Each edge indicates the presence of a relationship between two nodes. Fuzzy weights (Edge thickness and colour intensity): The strength or intensity of collaboration is encoded using the thickness and colour of edges. Stronger collaborations, such as frequent co-authorship or highly impactful joint work, are depicted with thicker and darker lines, while weaker or one-off collaborations appear as thinner, lighter edges.
Interdisciplinary collaboration (Color-coded nodes): Nodes that represent researchers working across multiple disciplines are distinguished using unique colours, highlighting their role in bridging diverse research areas.
5.1.2 Interpretation of the diagram
Strong collaborations: Connections with high fuzzy weights (e.g., 0.8–1.0) indicate robust academic ties— researchers who frequently publish together, collaborate across multiple projects, or receive joint citations. Weak collaborations: Low fuzzy weights (e.g., 0.1–0.3) indicate minimal interaction, possibly one-time co-authorships or informal affiliations with little sustained engagement.
Core influencers: Central nodes with multiple high-weight connections are identified as key contributors or influencers within the research institution. These individuals often act as hubs, facilitating knowledge flow and collaboration across departments.
Emerging collaborators: Nodes on the periphery with few or low-weight connections may represent early-career researchers or newly established partnerships, offering potential for future growth and collaboration.
5.1.3 Applications of the fuzzy Co-authorship network in fuzzy social network analysis
The fuzzy co-authorship network diagram serves multiple strategic and analytical purposes:
I. Institutional insights: Helps administrators and research managers assess the strength and distribution of internal and external collaborations, identify isolated researchers, and foster more integrated research environments.
II. Interdisciplinary mapping: Facilitates the visualization of cross-domain research efforts, highlighting areas where interdisciplinary collaboration is active or where potential synergies can be developed.
III. Strategic funding decisions: Enables funding agencies and policy-makers to evaluate collaboration patterns and identify high-impact research clusters for investment and support.
IV. Collaborator discovery: Assists individual researchers in identifying potential collaborators based on existing networks, common research interests, or complementary expertise.
5.2 Illustration 2
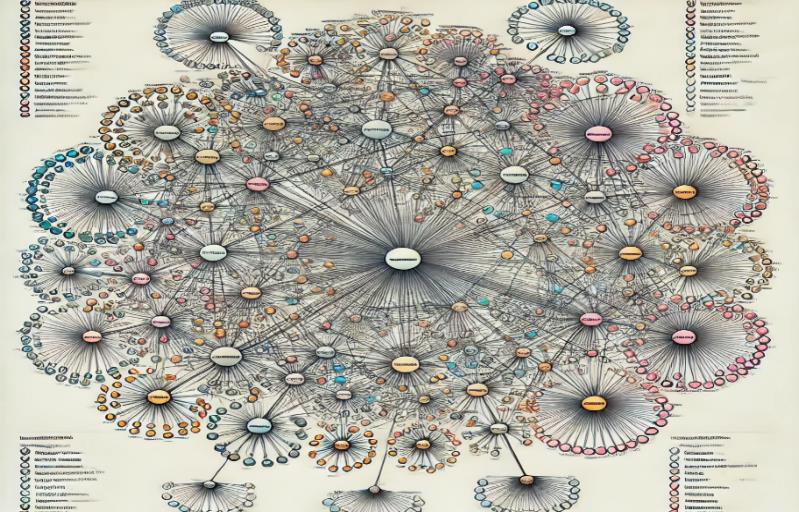
The fuzzy co-authorship network diagram provides a visual and conceptual model of how researchers within an academic institution engage in collaborative activities. By incorporating fuzzy logic into the network structure, the diagram captures not only the existence of co-authorship ties but also the intensity, uncertainty, and variability of these academic relationships (Fig. 5).
5.2.1 Components of the diagram
Nodes (Researchers and institutions): Each node in the network represents either an individual researcher or an academic institution. The size of a node reflects its centrality or influence within the network—larger nodes indicate more active or impactful collaborators.
Edges (Co-authorship relationships): Edges represent co-authored publications or joint research projects. The presence of an edge signifies that a collaborative relationship exists between two entities.
Fuzzy weights on edges: Each edge is associated with a fuzzy weight ranging from 0 to 1, denoting the strength or frequency of collaboration. Visually, this is conveyed through line thickness and colour intensity:
− Thicker, darker edges represent strong and frequent collaborations.
− Thinner, lighter edges indicate weaker or one-time collaborations.
Interdisciplinary collaboration (Color-coded nodes): To highlight cross-disciplinary activity, nodes are color-coded based on the research domains involved. Researchers working across multiple fields are shown in blended or distinct colors, emphasizing their role in interdisciplinary networks.
5.2.2 Interpretation of the diagram
Strong collaborations: Represented by bold, dark lines, these connections typically reflect long-term partnerships, frequent co-authorships, or highly cited joint publications.
Weak collaborations: Illustrated by light, thin edges, these relationships may represent initial collaborations, one-time publications, or marginal contributions.
Central influencers: Large nodes with numerous high-weight edges indicate researchers who serve as collaboration hubs. These individuals often bridge multiple teams or disciplines and significantly shape the institution’s research output.
Emerging collaborators: Smaller nodes located at the network periphery with a few low-weight edges signify newer or less established researchers. These nodes suggest potential for future integration and growth in collaboration.
5.2.3 Applications in industry, academic collaboration analysis
Identifying key contributors: The diagram aids in recognizing prolific researchers, team leaders, or mentors who contribute substantially to collaborative output.
Assessing interdisciplinary research: By examining color-coded nodes and cross-domain links, the diagram reveals the extent and nature of interdisciplinary interactions, guiding efforts to foster collaboration across fields.
Tracking collaboration trends: Over time, institutions can apply fuzzy network analysis to monitor evolving research dynamics, detect emerging partnerships, and make informed decisions regarding funding allocation, research policy, and strategic planning.
5.3 Illustration 3
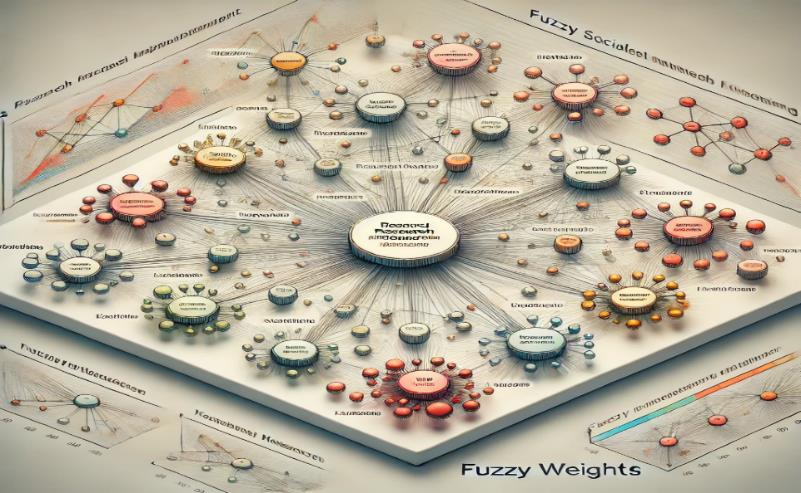
The research impact and influence ranking diagram, developed through the principles of FSNA, provides a comprehensive visual model for assessing academic influence and collaboration dynamics within scholarly networks (Fig. 6). Unlike traditional metrics that rely on citation counts or h-indices, FSNA incorporates the intensity, frequency, and interdisciplinarity of research collaborations, offering a more granular and contextual evaluation of academic performance.
5.3.1 Key components of the diagram
Nodes (Researchers and institutions): Each node in the diagram represents an individual researcher or academic institution. The size of a node is proportional to the researcher's influence, determined by the strength and diversity of their collaborations. Larger nodes indicate greater impact and centrality within the academic network.
Edges (Collaborations and co-authorships): Edges between nodes represent collaborative activities such as co-authorships or joint research projects. The thickness and color intensity of an edge reflect the strength of the relationship, based on publication frequency, joint citations, and contribution level.
Fuzzy weights on edges: Each edge is assigned a fuzzy weight in the range [0,1], which quantitatively captures the degree of influence or strength of collaboration. High fuzzy weights (e.g., 0.8–1.0): Strong, sustained collaborations, and Low fuzzy weights (e.g., 0.1–0.3): Infrequent or marginal interactions. These values allow for a more flexible and realistic modeling of academic relationships, accommodating uncertainty and partial contributions.
Influence and centrality measures: Researchers who are central in the network, with many high-weight connections, are identified as key influencers. These individuals often act as intellectual hubs, facilitating knowledge exchange across disciplines and institutions. Peripheral nodes with lighter edges represent researchers with fewer or emerging collaborations.
Interdisciplinary research mapping (Color-coded nodes): Nodes are color-coded based on research domains to highlight interdisciplinary collaboration. Researchers active in multiple fields are depicted using distinct or blended colours, providing insight into their cross-domain reach and impact.
5.3.2 Interpretation and applications
Accurate researcher ranking: FSNA provides a more holistic ranking system by incorporating fuzzy collaboration strength and disciplinary diversity, unlike conventional metrics that may overlook nuanced academic contributions.
Identifying key influencers: Researchers represented by larger, well-connected nodes are recognized as thought leaders or primary contributors, guiding institutional research strategy and collaboration networks. Tracking emerging scholars: Smaller nodes with increasing edge thickness over time can indicate rising influence—useful for identifying early-career researchers with high growth potential.
Improving institutional collaboration: Universities and research bodies can use FSNA-based diagrams to analyze and enhance collaboration patterns, identify underutilized links, and strategically support interdisciplinary initiatives.
Explanation of research impact and influence ranking using FSNA: FSNA enhances traditional research impact ranking by incorporating “Fuzzy logic” to model uncertainty, varying degrees of influence, and interdisciplinary collaborations.
Step 1. Define the academic network.
Nodes (V): Each researcher, institution, or journal is represented as a node.
Edges (E): Connections between nodes represent collaborations (e.g., co-authorship, citations, funding partnerships).
Fuzzy weights (ψ): Each edge is assigned a weight between 0 and 1, indicating the strength of collaboration or influence.
Step 2. Assign fuzzy membership values.
Every researcher (Node) is assigned a fuzzy membership function μ(v) that defines their involvement level in various academic activities.
Example:
I. A lead researcher on a paper may have a membership value of 1.0.
II. A secondary contributor may have a membership of 0.6.
III. A minimal contributor may have a membership of 0.3.
Step 3. Compute fuzzy influence measures.
To rank researchers effectively, we use fuzzy centrality measures, which include:
I. Fuzzy degree centrality: Measures how many collaborations a researcher has, weighted by the strength of each connection
II. Fuzzy betweenness centrality: Identifies researchers who act as bridges between different academic groups III. Fuzzy closeness centrality: Measures how quickly a researcher can access others in the network Step 4. Rank researchers based on fuzzy influence.
I. A composite fuzzy score is calculated by aggregating degree, betweenness, and closeness centralities.
II. This ranking accounts for:
− Quality over quantity (e.g., high-impact collaborations vs. many low-impact ones).
− Interdisciplinary influence (e.g., bridging multiple research fields).
− Citation-based adjustments (Fuzzy-weighted citations add more depth to the ranking).
Step 5. Generate a researcher influence ranking.
The final influence score is used to generate a ranked list of researchers based on their contributions and impact.
Table 1. Output.
This table is shown in the PDF version of the article.
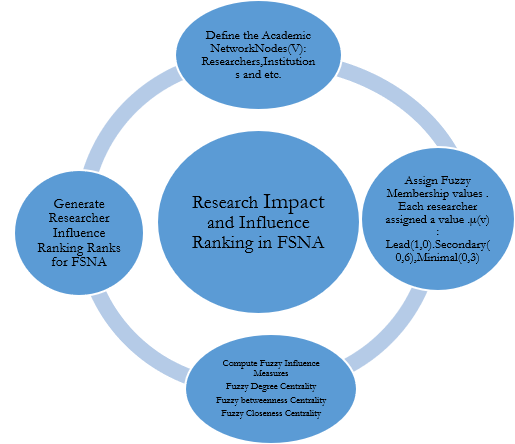
Fig. 7 is illustrating research impact and influence ranking in FSNA. It visually represents how researchers are ranked based on fuzzy relationships, collaboration strength, and influence measures.
6. Conclusion
FSNA provides a robust framework for analyzing academic collaborations by incorporating uncertainty, varying degrees of influence, and interdisciplinary connections. Unlike traditional SNA, FSNA allows for fuzzy-weighted relationships, enabling a more nuanced understanding of research impact, co-authorship dynamics, and institutional partnerships.
Through fuzzy influence ranking, FSNA enhances researcher evaluation by considering not only the number of collaborations but also their strength and significance. The integration of fuzzy centrality measures—such as fuzzy degree, betweenness, and closeness—ensures that ranking methodologies capture partial contributions, interdisciplinary work, and evolving research roles more effectively.
The application of FSNA in industry academic networks demonstrates its potential to improve institutional decision-making, funding allocation, and interdisciplinary collaboration strategies. Future research can explore the integration of machine learning techniques with FSNA to further enhance predictive modelling and dynamic research impact assessment.
Conflict of Interest
The authors declare no conflict of interest.
Data Availability
All data are included in the text.
Funding
This research received no specific grant from funding agencies in the public, commercial, or not-for-profit sectors.
References
- [1] Porreca, A., Maturo, F., & Ventre, V. (2025). Fuzzy centrality measures in social network analysis: Theory and application in a university department collaboration network. International journal of approximate reasoning, 176, 109319. https://doi.org/10.1016/j.ijar.2024.109319
- [2] Porreca, A., Maturo, F., & Ventre, V. (2024). Fuzzy social network analysis: Theory and application in a university department’s collaboration network. https://doi.org/10.48550/arXiv.2407.02401
- [3] Porreca, A., Maturo, F., & Ventre, V. (2024). Novel fuzzy centrality measures in vague social networks. International journal approx. reasoning, 176, 109319. https://doi.org/10.48550/arXiv.2407.02401
- [4] Borgatti, S. P., Everett, M. G., & Johnson, J. C. (2024). Analyzing social networks. SAGE Publications Ltd. https://www.torrossa.com/en/resources/an/5730558
- [5] Nepusz, T., Petróczi, A., Négyessy, L., & Bazsó, F. (2008). Fuzzy communities and the concept of bridgeness in complex networks. Physical review e—statistical, nonlinear, and soft matter physics, 77(1), 16107. https://doi.org/10.1103/PhysRevE.77.016107
- [6] West, D. B. (2001). Introduction to graph theory (Vol. 2). Prentice Hall.
- [7] Zadeh, L. A. (1965). Fuzzy sets. Information and control, 8(3), 338–353. https://doi.org/10.1016/S0019-9958(65)90241-X
- [8] Bondy, J. A., & Murty, U. S. R. (2008). Graph theory. Berlin: Springer. https://B2n.ir/wh1209
- [9] Diestel, R. (2005). Graph Theory. Springer. https://books.google.com/books/about/Graph_Theory.html?id=aR2TMYQr2CMC
- [10] Wasserman, S., & Faust, K. (2012). Social network analysis: Methods and applications. Cambridge University Press. https://B2n.ir/jy7219
- [11] Brandes, U. (2005). Network analysis: Methodological foundations. Springer Science & Business Media. https://B2n.ir/mk1395