Soft Computing Fusion with Applications
Abstract
This study evaluates the Marine Predators Algorithm (MPA) as a binary wrapper feature selector for a support vector machine on the Wisconsin Diagnostic Breast Cancer (WDBC) dataset. The scalar objective combines cross - validation classification error and no rmalized subset cardinality with accuracy weight 0.9. Ten comparator optimizers were evaluated under a reported common population size of 20 and 100 iterations over 30 runs. The recorded tables give MPA the highest mean accuracy, 98.49%, and the smallest m ean subset, 11.13 of 30 features, a 62.9% reduction.
These summaries describe a single retrospective benchmark. Their interpretation is conditional on resolving the reported accuracy, sensitivity and specificity aggregation and on recovering the paired run - level outputs and evaluation counts. The supplied one - sided Wilcoxon p - values are nominal comparisons rather than evidence of superiority after every possible multiplicity correction. The results motivate further evaluation of the wrapper; they do not est ablish early detection, biological validation or clinical readiness .
Keywords:
, , Breast cancer diagnosis , Metaheuristic optimization , Wrapper method , Support vector machine , WDBC dataset .
1 Introduction
Feature selection can simplify a classifier by restricting the measured descriptors while preserving useful predictive information. The ( WDBC ) benchmark contains image - derived nuclear morphology features from fine - needle aspirates of breast masses [1] . It is a retrospective diagnostic classification dataset, rather than a screening cohort or a longitudinal study of early detection. A Corresponding Author: jpourmail@gmail.com https://doi.org/10.22105/scfa.v3i2.104 Licensee System Analytics . This article is an open access article distributed under the terms and conditions of the Creative Commons Attribution (CC BY) license (http://creativecommons.org/licenses/by/4.0).
Pourqasem et al. | Soft. Comput. Fusion. Appl. 3 ( 2 ) ( 2026 ) 114 - 125 computational comparison on these records therefore addresses benchmark classification and subset compactness, while clinical benefit requires separate validation. WDBC contains thirty real - valued descriptors: mean, standard - error and worst - value summaries of ten nuclear attributes [1] . A full search over binary masks has 1,073,741,824 possible masks, exceeding one billion.
Correlated descriptors can make several distinct subsets similarly predictive, so a small selected mask does not by itself identify a unique biological mechanism. Co mpactness is a computational design objective whose practical value depends on measurement cost and external validation. ( MPA ) uses phased Brownian and Lévy updates, an elite representation and memory - based replacement [2] . These components provide a stochastic search strategy for nonlinear objectives; their original continuous formulation is not automatically a specification of binary feature selection. Here the reported binary adaptation is examined alongside ten alternat ive optimizers under one wrapper objective.
A useful comparison must separate the optimizer from preprocessing, classifier configuration and evaluation design. Matching population size and iteration count controls two settings but does not guarantee equal objective evaluations. The same untouched te st split, paired experimental units and documented binary updates are needed before differences can be attributed to the search procedure. The study contributes a reported comparison of eleven wrapper search methods, a joint accuracy - cardinality objective and descriptive feature - selection patterns on WDBC. It does not establish that this is the largest comparison in the literature. The statis tical and computational interpretation is bounded by the run - level evidence, metric definitions and implementation details described below.
2 Related Work
The relevant methodological literature concerns the search representation, the classifier within the wrapper and the validity of algorithm comparison. These questions are more directly informative than the biological metaphor associated with each optimizer .
2.1 Metaheuristics in Medical Diagnosis
The WDBC repository describes nuclear feature extraction and a separating - plane construction using a small - feature exhaustive search [1] . The present wrapper uses an SVM [3] to score candidate masks. Its results should be compared with earlier methods only under compatible datasets, partitions, preprocessing and tuning protocols; published accuracy numbers from different protocols are not a common leaderboard.
Nature - inspired search provides a range of update rules for wrapper optimiza tion [2, 4 ² 9] . Their performance is empirical and problem - dependent. This comparison examines ten alternatives to MPA, but does not establish that other medical feature selectors or simpler deterministic baselines have been exhausted.
2.2 Feature Selection Paradigms
Filter methods score variables independently of a chosen learner, wrappers evaluate subsets through a fitted prediction model, and embedded methods perform selection within model fitting. A wrapper can capture learner - specific interactions, but repeated sc oring can overfit its validation criterion. Final predictive performance must therefore be assessed on data that played no role in selecting the mask or configuring the learner.
The objective studied here is a weighted scalarization of classification error and subset cardinality, rather than a Pareto optimization procedure. Overall accuracy weights errors according to class frequency and does not encode a larger false - negative cos t. The coefficient 0.9 is a design choice about accuracy and feature count, not an empirically elicited clinical risk preference. «
2.3 The Marine Predators Algorithm and Comparison Methods
The canonical MPA implementation schedules a Brownian phase, a mixed Brownian - Lévy phase and a late Lévy phase, with elite, memory and environmental perturbation operations [2] . The interpretation of these operations as exploration or exploitation is conditional on the landscape and parameter settings. A best - fitness trace alone cannot identify which component causes an observed gain. A binary wrapper also needs a precise transfer rule, continuous bounds, clipping convention and empty - mask policy. The reported use of a hyperbolic tangent does not determine these choices. A nonnegative V - shaped probability may use |tanh(z)|, but whether it flips an existing bit or assigns a new bit changes the algorithm.
The experimental implementation must determine which rule was actually evaluated. The comparison includes GA [10] , PSO [11] , DE [12] , ABC [13] , GWO [4] , WOA [5] , HHO [6] , AO [7] , SMA [8] and SSA [9] . This is a specified comparator set rather than the full contemporary metaheuristic landscape. Each continuous - to - binary adaptation and its objective - call budget must be documented consistently.
3 Methodology
The reported protocol combines WDBC, a stratified holdout, five - fold training - partition cross - validation and repeated stochastic search. This section specifies the documented settings and distinguishes them from implementation details required to reproduce the recorded tables.
3.1 Dataset Description
WDBC consists of 569 records with thirty morphology features and two classes, 357 benign and 212 malignant [2] . The features describe nuclei from digitized fine - needle aspirates. These are correlated image - derived descriptors, not independently validated molecular biomarkers. Table 1. Characteristics of the WDBC dataset. Property Value Number of instances 569 Number of features 30 (real - valued)
Feature blocks Mean (10), Standard error (10), Worst (10) Class distribution 357 benign, 212 malignant Missing values None Source UCI Machine Learning Repository Task Binary classification Table 1 records the dataset properties. There are no missing values in the distributed dataset [1] . The malignant proportion is approximately 37.3%, making sensitivity, specificity and the aggregation of overall accuracy important when interpreting the results.
3.2 Preprocessing
The reported procedure uses a 70% training and 30% stratified test split and five - fold cross - validation within training. Standardization is estimated from the training partition rather than the test set. For cross - validation fitness, scaling must additiona lly be fitted inside each training fold to prevent validation - fold information from entering the scaler. The source description does not resolve whether that nesting was implemented, whether the split was fixed across runs, or how SVM C and kernel gamma we re chosen. The test set must remain outside mask selection and all tuning.
3.3 Problem Formulation
A feature mask x is a binary vector of length d = 30, with s selected variables. The minimized scalar objective shown below uses training - only cross - validation accuracy as a fraction in [0,1], combining its complement Pourqasem et al. | Soft. Comput. Fusion. Appl. 3 ( 2 ) ( 2026 ) 114 - 125 with normalized mask cardinality. The treatment of an empty mask must be specified because an SVM cannot be fitted without features. No asymmetric clinical error cost or global - optimality guarantee is encoded by this formula.
? ? ? ? ? ? ? ?? ? ? ? ? ? ? ? ? ? ? ? ? ? ? ? ?
3.4 MPA-Based Wrapper Framework
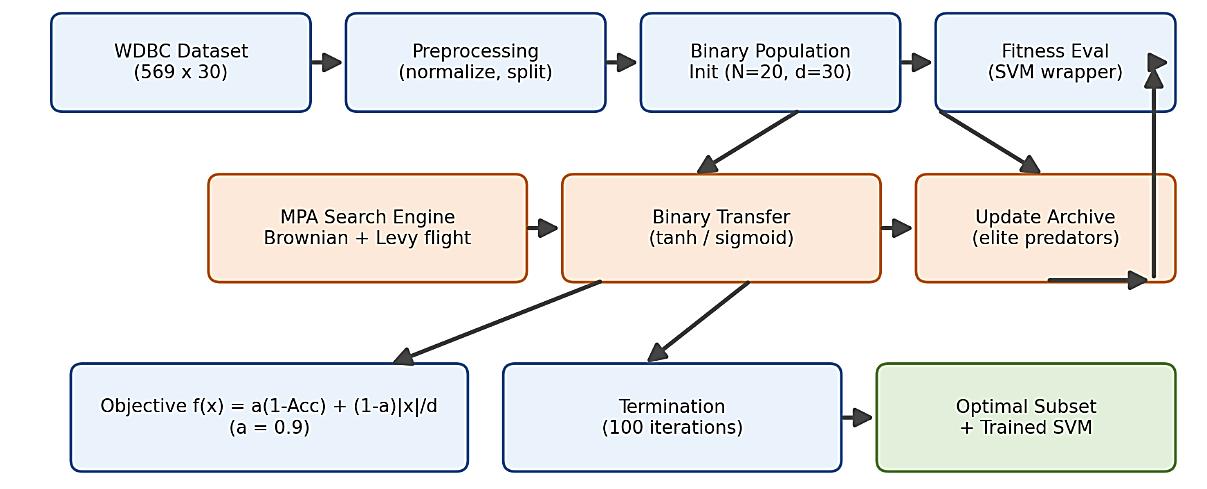
The wrapper represents a candidate by a continuous search state and a binary feature mask. The mask is evaluated by an SVM using training - partition cross - validation, and the scalar fitness guides the MPA search. The reported phase schedule follows the Brow nian, mixed and Lévy phases of MPA [2] . Fig . 1 shows the intended workflow. The evaluated implementation must specify memory replacement, environmental perturbations, phase boundaries and the binary transfer convention; these cannot be reconstructed uniquely from the diagram.
Fig . 1 . Links preprocessing, candidate search and repeated wrapper evaluation. At termination the procedure returns the best mask found under its computational budget and a classifier fitted without using the test labels. The returned mask is a heuristic solution, not a proven optimum. An interchangeable optimizer interface facilitat es comparison only when its data access, scoring and evaluation budgets are controlled.
3.4.1 | MPA update and binary encoding In canonical MPA, the first third of the search uses Brownian updates, the middle third splits the population between Brownian and Lévy updates, and the final third uses Lévy updates around the elite state, together with a decaying control factor and memor y operations [2] . The manuscript does not provide the complete implemented update equations. Its binary adaptation additionally requires a nonnegative transfer probability, a bit - assignment or bit - flipping rule and a feasible - mask repair. The reported outcomes refer to th at implementation; the ecological description alone is not a reproducibility specification.
3.5 Comparison Algorithms and Parameterization
The recorded GA settings are tournament selection, single - point crossover probability 0.8 and bit - flip mutation probability 0.05. PSO uses inertia decreasing from 0.9 to 0.4 and cognitive and social coefficients 2.0. DE uses a rand - to - best mutation strateg y, factor 0.5 and crossover probability 0.9. The ABC description specifies a 100 - trial abandonment limit but does not uniquely define employed, onlooker and scout allocation.
Other optimizers are described as following their source publications [4 ² 8] . Population size 20 and 100 iterations are shared. Applying a transfer function to methods already operating on bits, and additional objective calls in multi - stage updates, must be distinguished in the implementation record. « Table 2. Common experimental settings shared by all eleven algorithms. Parameter Value Justification Population size 20 Standard for small - d medical FS Iterations 100 Matches budget used in prior WDBC studies Independent runs 30 Repeated stochastic optimization Classifier SVM (RBF kernel)
Strong baseline on WDBC CV folds (fitness) 5 Robust fitness estimate Train/test split 70% / 30% stratified Preserves class balance Transfer function tanh (binary) Binary update convention unresolved Weighting alpha 0.9 Reported accuracy - cardinality preference Search dimension d 30 WDBC feature count Table 2 records the common design settings. The RBF SVM configuration and its training - only parameter selection must be fixed across optimizers. Equal population size and iterations do not imply an equal number of fitness evaluations, so the table does not by its elf prove budget fairness. Thirty stochastic runs describe optimizer variability on the chosen data; they are not thirty independent clinical cohorts.
3.6 Computational Complexity
Let E be the actual number of mask evaluations, K the number of cross - validation folds and C(n,s) the per - fold fitting and scoring cost for n training observations and s selected features. The principal wrapper cost is approximately E·K·C(n,s ), plus search - update and preprocessing costs. Kernel construction contributes O(n²s), while solver cost and memory depend on the SVM implementation and data. Fewer features may reduce kernel construction cost, but no wall - clock advantage follows without m easured runtimes, hardware details and objective - call counts.
3.7 Evaluation Metrics and Statistical Testing
Performance is summarized by accuracy, F1, ROC AUC, sensitivity, specificity and selected - feature count. Malignant is the positive class in the reported encoding. For a common fixed test population, accuracy satisfies $FF ??6HQVLWLYLW\ î? ? 6SHFLILFLW\ZKHUH?LVPDOLJQDQWSUHYDOHQFH Table 3 requires reconciliation with this identity or an explicit explanation of differing evaluation populations and averaging. The reported one - sided Wilcoxon comparisons use per - run accuracy; valid pairing must share the experimental split and randomization un it [14] . The nominal p - values in Table 5 do not independently establish corrected significance.
3.8 Experimental Protocol
The protocol reports thirty runs of each of eleven methods, totaling 330 optimization runs, with masks, training cross - validation scores, test metrics and convergence traces. Those run - level outputs, code, split indices, classifier parameters and environme nt versions are required to audit the recorded summaries. The reported Python, scikit - learn and SciPy implementation has no supplied versioned release or execution artifact, so exact numerical reproduction is not established by the present description.
4 Results
Tables 3 - 5 retain the reported numerical summaries, while Fig s . 2 - 7 retain the recorded visualizations. Rankings describe those summaries. Their inferential and clinical interpretation remains conditional on resolving metric aggregation, run pairing, split integrity and computational budgets.
4.1 Classification Performance
In Table 3 , MPA has the largest reported mean accuracy, 98.49%, 0.29 percentage points above HHO and 1.12 above the all - feature baseline. Its reported sensitivity is 98.56%. The accuracy standard deviation is 0.23 percentage points, rather than a variance of 0.23%; GA has the largest listed standard deviation, 0.90, followed Pourqasem et al. | Soft. Comput. Fusion. Appl. 3 ( 2 ) ( 2026 ) 114 - 125 by PSO at 0.78. These summaries do not prove generalization or stability outside the recorded runs, and their joint confusion - matrix consistency must be resolved.
Table 3. Classification performance of all eleven algorithms and the all - feature baseline, reported as mean +/ - standard deviation over 30 independent runs on the WDBC dataset. Accuracy (%) F1 (%) AUC (%) Sensitivity (%) Specificity (%) MPA (proposed) 98.49 +/ - 0.23 98.27 +/ - 0.36 98.87 +/ - 0.38 98.56 +/ - 0.41 97.84 +/ - 0.45 HHO 98.20 +/ - 0.47 98.18 +/ - 0.59 98.56 +/ - 0.57 98.40 +/ - 0.60 97.59 +/ - 0.60 GWO 98.17 +/ - 0.48 98.11 +/ - 0.62 98.63 +/ - 0.60 98.24 +/ - 0.62 97.57 +/ - 0.60 SMA 97.95 +/ - 0.51 97.86 +/ - 0.55 98.41 +/ - 0.66 98.00 +/ - 0.59 97.38 +/ - 0.72 WOA 97.73 +/ - 0.47 97.69 +/ - 0.58 98.16 +/ - 0.61 97.70 +/ - 0.62 97.17 +/ - 0.58 DE 97.71 +/ - 0.36 97.64 +/ - 0.44 98.07 +/ - 0.40 97.70 +/ - 0.52 97.15 +/ - 0.44 AO 97.70 +/ - 0.49 97.70 +/ - 0.58 98.12 +/ - 0.64 97.70 +/ - 0.65 97.12 +/ - 0.62 ABC 97.51 +/ - 0.67 97.38 +/ - 0.62 97.95 +/ - 0.65 97.51 +/ - 0.71 96.95 +/ - 0.79 SSA 97.47 +/ - 0.55 97.30 +/ - 0.62 97.86 +/ - 0.69 97.47 +/ - 0.58 96.84 +/ - 0.70 GA 97.35 +/ - 0.90 97.30 +/ - 1.05 97.75 +/ - 0.96 97.36 +/ - 1.05 96.67 +/ - 0.87 PSO 97.22 +/ - 0.78 97.00 +/ - 0.77 97.63 +/ - 0.80 97.17 +/ - 0.84 96.53 +/ - 0.94 Baseline (all 30)
97.37 +/ - 0.00 97.02 +/ - 0.00 97.12 +/ - 0.00 96.50 +/ - 0.00 97.89 +/ - 0.00 The recorded accuracy ordering places MPA, HHO and GWO above 98.1%, with a 0.32 - point span. SMA, WOA, DE and AO form an intermediate group. ABC and SSA exceed the all - feature baseline, whereas GA at 97.35% and PSO at 97.22% are below its 97.37%. Thus feature selection does not improve the listed mean accuracy for every optimizer. No mechanism or clinical advantage follows from this ordering alone.
4.2 Feature Subset Compactness
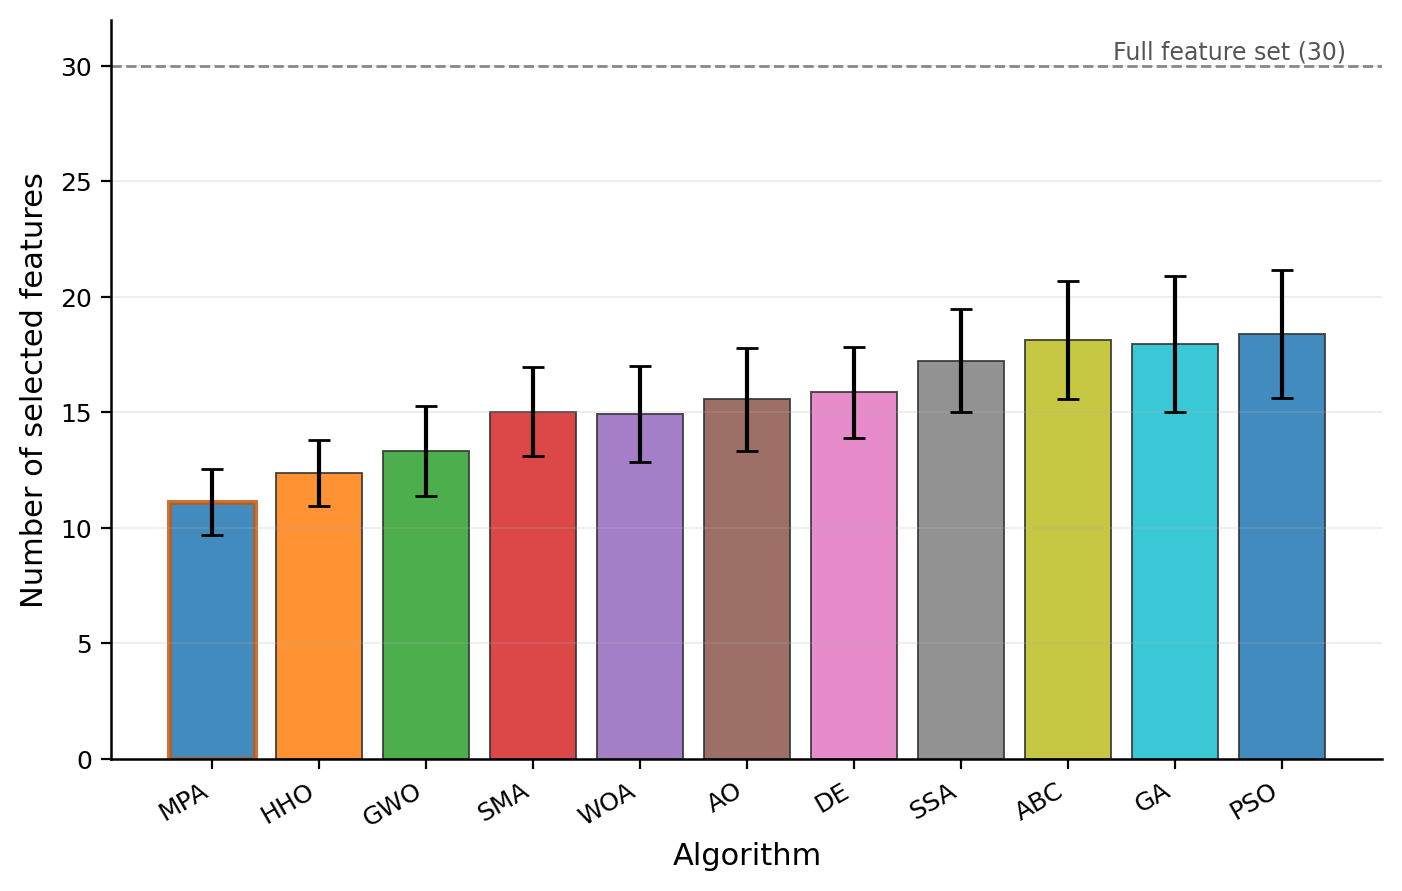
Table 4 reports the feature - count means and standard deviations. MPA selects 11.13 variables on average, FRUUHVSRQGLQJWR î UHGXFWLRQ++2DQG*:2UHWDLQPHDQVDQG362 and GA retain 18.40 and 17.97. This describes mask size; m easuring fewer correlated summaries from the same image does not automatically reduce specimen collection or imaging cost. Table 4. Mean number of selected features over 30 runs, with reduction relative to the full 30 - feature set.
Mean +/ - Std ) Reduction (%) MPA (proposed) 11.13 +/ - 1.43 62.9 HHO 12.37 +/ - 1.43 58.8 GWO 13.33 +/ - 1.94 55.6 WOA 14.93 +/ - 2.07 50.2 SMA 15.03 +/ - 1.92 49.9 AO 15.57 +/ - 2.22 48.1 DE 15.87 +/ - 1.96 47.1 SSA 17.23 +/ - 2.22 42.6 GA 17.97 +/ - 2.95 40.1 ABC 18.13 +/ - 2.54 39.6 PSO 18.40 +/ - 2.76 38.7 The recorded mean accuracy and subset size both favor MPA within this comparator set. Its 62.9% count reduction exceeds PSO's 38.7% by 24.2 percentage points. This is a descriptive accuracy - cardinality comparison, not evidence of a universal frontier or a validated eleven - marker clinical panel.
Fig . 2 visualizes the subset - count summaries. « Fig . 2 . Mean subset counts and one - standard - deviation error bars across runs, with the full thirty - variable set as a reference. These bars describe variability in count, not agreement in feature identity. Stability of a selected mask would require overlap or selection - frequency analyses and validation on resampled or external data.
4.3 Convergence Behavior
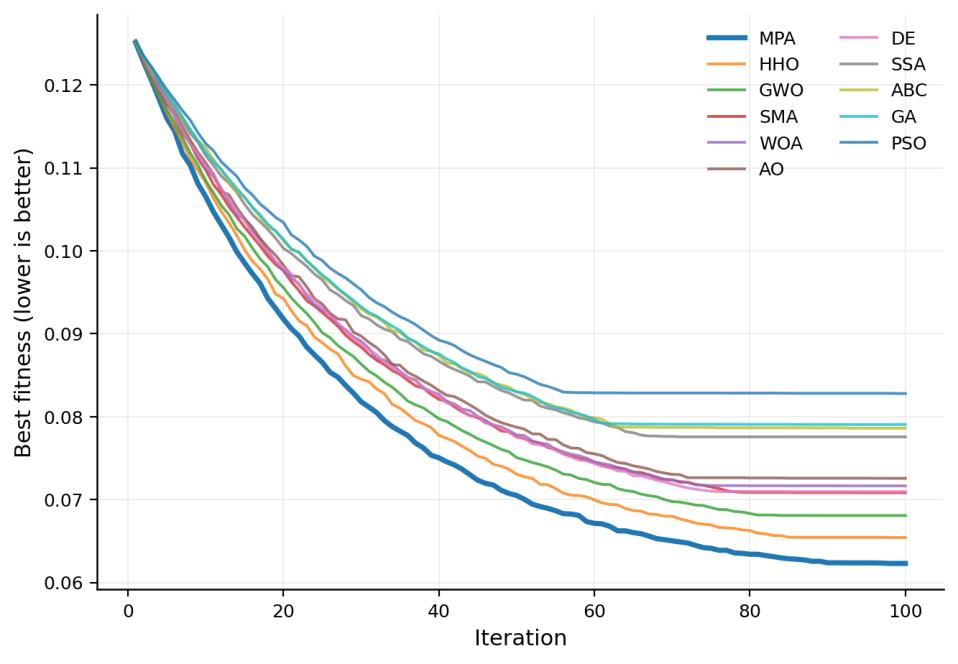
Fig . 3 shows the reported median best - fitness trajectories. MPA decreases early and continues to improve within the recorded iteration budget, while some comparators plateau earlier. Best - fitness traces describe optimizer progress under the scalar objective; the y cannot separate the effects of Brownian updates, Lévy steps, memory or binary repair without component ablations. Fig. 3 . The reported median best - fitness trajectories .
The recorded terminal objective values broadly follow the accuracy - cardinality ordering. A lower scalar fitness can reflect either lower cross - validation error or fewer variables, and must not be interpreted as test accuracy alone. Comparing traces by iter ations also requires objective - call counts because one iteration can contain different amounts of scoring work. Pourqasem et al. | Soft. Comput. Fusion. Appl.
3 ( 2 ) ( 2026 ) 114 - 125
4.4 Statistical Significance
Table 5 retains ten reported one - sided Wilcoxon statistics and nominal p - values. The HHO comparison has p = 0.0057 and the GWO comparison p = 0.0010; eight comparisons are listed as p < 0.0001. Nine p - values are therefore at or below 0.001, rather than strictly b elow it. Paired run outputs and tie handling are needed to reproduce the tests. Table 5. Wilcoxon signed - rank test results for the pairwise comparison of MPA against each competitor (one - sided, MPA yields higher accuracy), over 30 independent runs.
Comparison Statistic p - Value Significant (p < 0.05) MPA vs HHO 354.0 0.0057 Yes MPA vs GWO 378.0 0.0010 Yes MPA vs SMA 424.0 < 0.0001 Yes MPA vs WOA 450.0 < 0.0001 Yes MPA vs DE 460.0 < 0.0001 Yes MPA vs AO 464.0 < 0.0001 Yes MPA vs SSA 462.0 < 0.0001 Yes MPA vs ABC 454.0 < 0.0001 Yes MPA vs GA 447.0 < 0.0001 Yes MPA vs PSO 465.0 < 0.0001 Yes Multiplicity changes the interpretation of nominal significance. A Bonferroni threshold for ten comparisons is 0.005, which the HHO value 0.0057 does not meet. Holm correction could retain all ten recorded comparisons if the reported nominal p - values and p airing are correct, but adjusted results have not been independently reconstructed from the runs. These tests concern optimizer randomness under the experimental data design, not clinical sampling uncertainty.
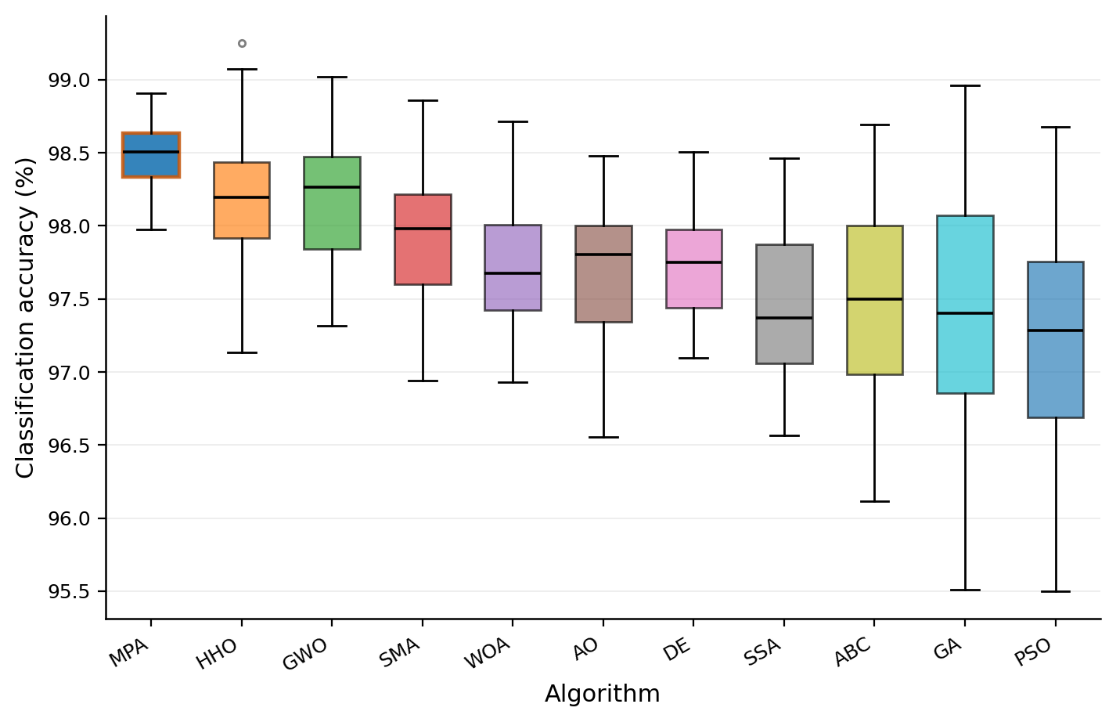
Fig. 4. The recorded distributions . Fig . 4 displays the recorded accuracy distributions across runs. MPA has the highest central location and the smallest listed accuracy standard deviation. Overlap between distributions, shared test observations and unresolved metric aggregation limit interpretat ion; the plot does not establish a causal explanation of search behavior.
4.5 Feature Selection Patterns
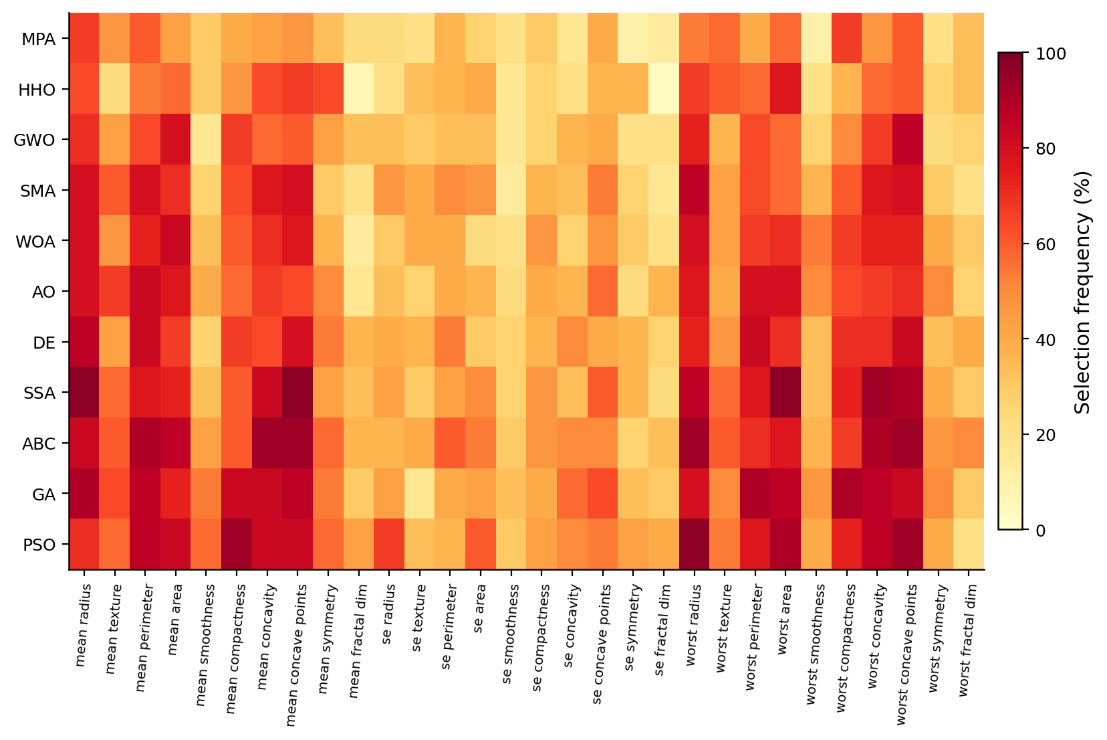
Fig . 5 displays the reported feature - selection frequencies. Several mean and worst - value morphology descriptors are frequently retained, while many standard - error features are less frequent. A frequency pattern « reflects the wrapper, correlated predictors and the data partition; it does not validate the biological role of a feature or show that all low - frequency features are uninformative.
Fig. 5 . The reported feature - selection frequencies . The heatmap suggests a common predictive core across methods and differences in how broadly they retain variables. Interpreting sharper frequency differences as a Lévy - driven effect would require an ablation with the same evaluation budget. Identifying a c linically reliable mask additionally requires stability assessment and validation outside WDBC.
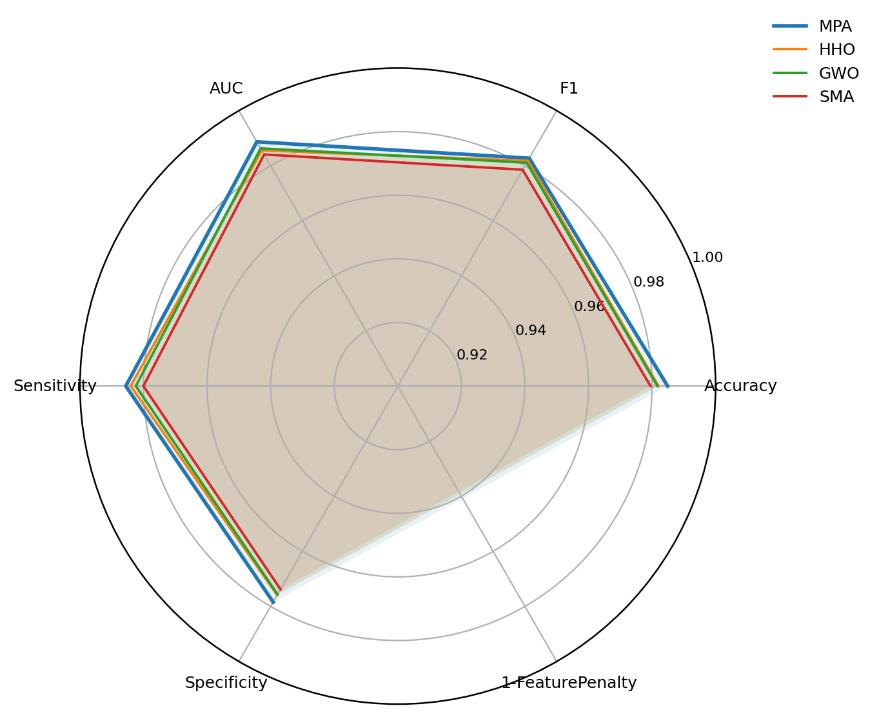
Fig . 6 . The recorded metrics using normalized radar axes for MPA, HHO, GWO and SMA . Fig . 6 summarizes the recorded metrics using normalized radar axes for MPA, HHO, GWO and SMA. Its apparent polygon areas depend on normalization, axis order and the chosen feature penalty. The tabulated values provide the quantitative comparison; radar area is n ot a statistical test, utility function or Pareto certificate.
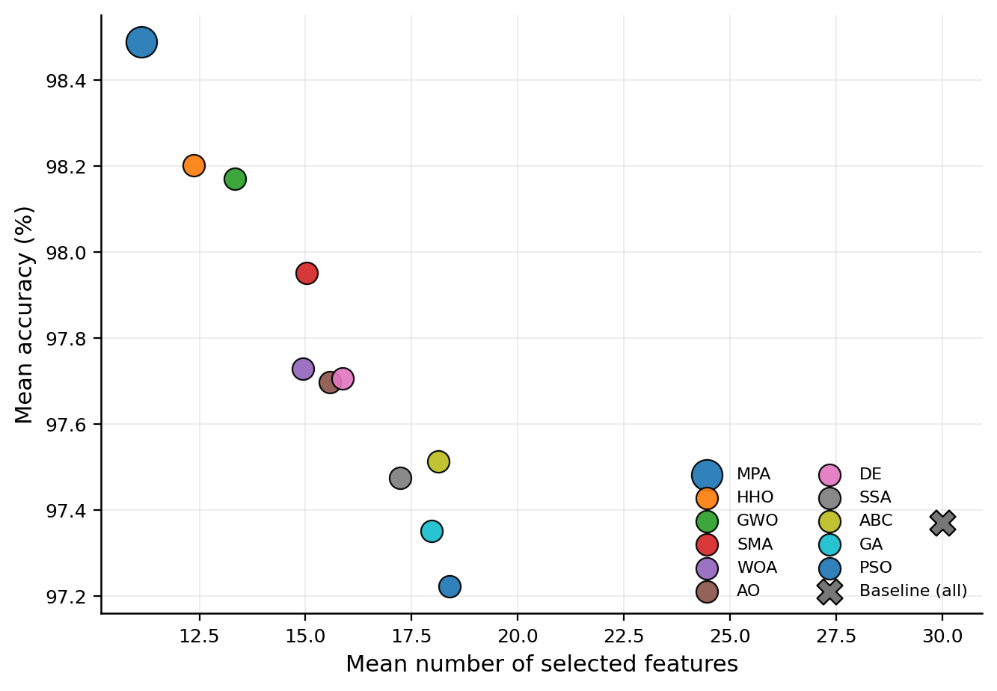
Pourqasem et al. | Soft. Comput. Fusion. Appl. 3 ( 2 ) ( 2026 ) 114 - 125 Fig . 7 . Mean accuracy against mean subset size . Fig . 7 plots mean accuracy against mean subset size. MPA is the most favorable recorded point in this two - dimensional comparison. The all - feature baseline has the largest count, but exceeds GA and PSO in reported accuracy. This plot illustrates trade - offs among the measured means rather than proving that every feature selector improves generalization.
5 Discussion
The reported tables favor MPA in mean accuracy and subset count, but establish a benchmark observation rather than a general or clinical preference. The interpretation depends on reconciling the metric summaries and documenting the validation and search im plementations.
5.1 Interpretation of the Recorded Performance
MPA's phased movement, memory replacement and environmental updates are plausible contributors to search performance [2] . The recorded convergence curves do not isolate their effects. Controlled ablations and matched objective - call budgets would be required to determine whether Lévy movement, memory or the binary encoding explains the observed ordering. Memory is not unique to MPA: canonical PSO stores personal and global bests [11] , and GA can use elitist retention [10] . The reported standard deviations, 0.23 for MPA and 0.78 for PSO, describe these configurations rather than an inherent stability ordering of their algorithm families. Wilcoxon tests compare output distributions and do not identify a memory mechanism.
5.2 Exploration Versus Exploitation
Exploration and exploitation depend on both update rules and the evaluated landscape. Larger subsets or early plateaus do not diagnose an optimizer as excessively exploratory or exploitative. The recorded comparison is useful for this wrapper configuration , but a mechanistic interpretation needs controlled changes to the search components and budgets. HHO and GWO have near - MPA reported accuracies with larger mean masks. HHO's rapid - dive operations can themselves use Lévy steps [6] , so their absence cannot explain MPA's result. Compactness may matter in choosing an experimental configuration, but this comparison does not establish clinical superiority or a universally preferred optimizer.
«
5.3 Morphological Interpretation
Selected radius, perimeter, area, concavity and concave - point descriptors quantify nuclear morphology [1] . Their frequent selection is compatible with predictive use of size and contour information. Correlation among descriptors and the lack of external biological validation prevent treating the optimizer output as identification of independent disease mechan isms. Lower selection frequency for standard - error variables does not establish that they lack diagnostic information. The wrapper can substitute correlated descriptors, and a selection pattern on one dataset may change under resampling, a different classifier o r a different objective. Biological interpretation should therefore remain descriptive.
5.4 Comparison with Prior Work
Comparisons with prior medical classifiers require equivalent data, splits, preprocessing, tuning and metrics. Accuracy figures reported under other protocols cannot establish a discriminative ceiling or a state - of - the - art ordering for the present wrapper. The contribution is the specified comparator experiment and its documented limits, rather than a cross - paper accuracy ranking. The eleven - method suite is broader than a two - method comparison, but its coverage is finite. Formal tests add information only when run pairing and data dependence are explicit [14] . The unresolved confusion - matrix identity and implementation record are more important to validity than the number of competitors or nominally significant p - values.
5.5 Limitations
This study uses a single retrospective benchmark and one wrapper learner. Training - only cross - validation, scaling nested inside folds, a documented untouched holdout and clear SVM parameter selection are needed to assess leakage. The reported accuracy, sen sitivity and specificity require a common averaging convention and paired confusion matrices before performance conclusions can be considered validated.
The fixed population and iteration settings do not prove matched objective - call or tuning budgets. Run - level outputs are also needed to reproduce significance tests and quantify subset identity stability. No prospective cohort, clinical workflow cost, mech anism ablation or independent external validation is reported. These are substantive limits on publication and translation, rather than evidence that the recorded ranking must generalize.
6 Conclusion
The study evaluates an MPA - driven binary wrapper using an SVM and a scalar accuracy - cardinality objective on WDBC. The reported comparison covers ten alternatives and thirty runs per optimizer. The weight 0.9 expresses an accuracy - cardinality preference an d does not encode false - negative clinical risk. The recorded MPA means are 98.49% accuracy, 11.13 selected variables and 98.56% sensitivity, with a 62.9% feature - count reduction and an accuracy standard deviation of 0.23 percentage points. These values are retained as reported. Their joint metric aggreg ation, paired inferential analysis and execution provenance must be resolved before treating them as validated predictive results. Convergence and feature - frequency figures provide descriptive evidence, not causal component attribution or biological confir mation.
MPA is a candidate wrapper optimizer for further controlled evaluation. The next scientific steps are recovery of masks, split indices, paired predictions, classifier configurations and objective - call logs, followed by a leakage - safe replication and extern al - cohort validation where clinical claims are intended. The present evidence supports neither an early - detection claim nor a recommendation for deployment.
Pourqasem et al. | Soft. Comput. Fusion. Appl. 3 ( 2 ) ( 2026 ) 114 - 125
Funding
This research received no external funding.
Data Availability
Sufficient data is available upon request.
Conflict of Interest
No potential conflict of interest was reported by the authors.
Consent for Publication
All authors have provided their consent for the publication of this manuscript.
References
[1] Wolberg, W., Mangasarian, O., Street, N., & Street, W. (1993). Breas t cancer wisconsin (diag nostic) [Dataset]. https://doi.org/10.24432/C5DW2B [2] Faramarzi, A., Heidarinejad, M., Mirjalili, S., & Gandomi, A. H. (2020). Marine gorithm: A nature - inspired metaheuristic. Expert systems with applications , 152 , 113377. https://doi.org/10.1016/j.eswa.2020.113377 [3] Cortes, C., & Vapnik, V. (1995). Support - vector networks.
Machine learning, 20 , 273 ? 297. https://doi.org/10.1007/BF00994018 [4] Mirjalili, S., Mirjalili, S. M., & Lewis, A. (2014). Grey wolf optimizer. Advances in engineering software , 69 , 46 ? 61. https://doi.org/10.1016/j.advengsoft.2013.12.007 [5] Mirjalili, S., & Lewis, A. (2016). The whale optimization alg orithm. Advances in engineering software , 95 , 51 ? 67. https://doi.org/10.1016/j.advengsoft.2016.01.008 [6] Heidari, A. A., Mirjalili, S., Faris, H., Aljarah, I., Mafarja, M., & Chen, H. (2019). Harris hawks optimization: Algorithm and applications.
Future generation com puter systems , 97 , 849 ? 872. https://doi.org/10.1016/j.future.2019.02.028 [7] Abualigah, L., Yousri, D., Abd Elaziz, M., Ewees, A. A., Al - Qaness, M. A. A., & Gandomi, A. H. (2021). Aquila Optimizer: A novel meta - heuristic optimization algorithm. Computers & industrial engineering, 157 , 107250. https://doi.org/10.1016/j.cie.2021.107250 [8] Li, S., Chen, H., Wang, M., Heidari, A. A., & Mirjalili, S. (2020). Slime mould algorithm: A new method for stochastic optimization.
Future generation computer systems, 111 , 300 ? 323. https://doi.org/10.1016/j.future.2020.03.055 [9] Mirjalili, S., Gandomi, A. H., Mirjalili, S. Z., Saremi, S., Faris, H., & Mirjalili, S. M. (2017). Salp swarm m: A bio - inspired optimizer for engineering design problems. Advances in engineering software , 114 , 163 ? 191. https://doi.org/10.1016/j.advengsoft.2017.07.002 [10] Holland, J. H. (1992).
Adaptation in natural and artificial systems: An introductory analysis with applications to biology, control, and artificial intelli gence. MIT Press. [11] Kennedy, J., & Eberhart, R. (1995). Particle swarm optimization. Proceedings of ??? , 4 , 1942 ? 1948. https://doi.org/10.1109/ICNN.1995.488968 [12] Storn, R., & Price, K. (1997). Differential evolution - a simple and efficient heuristic for global optimization over continuous spac es.
Journal of global optimization , 11 , 341 ? 359. https://doi.org/10.1023/A:1008202821328 [13] Karaboga, D. (2005). An idea based on honey bee swarm for numerical optimization . https://abc.erciyes.edu.tr/publ.htm [14] Derrac, J., García, S., Molina, D., & Herrera, F. (2011). A practical tutorial on the use of nonparametric statistical tests as a methodology for comparing evolutionary and swarm intelligence algorithms.
Swarm and evolutionary computation , 1 , 3 ? 18. https://doi.org/10.1016/j.swevo.2011.02.002
Figures